Pub Names
What?
A year into lockdown, one of the things I miss the most is going to the pub. Being at home hasn’t stopped me from drinking beers and talking nonsense at my friends, but it’s not quite the same through a screen is it? So, what’s my best alternative? Making graphs about pub names. That’s definitely it.
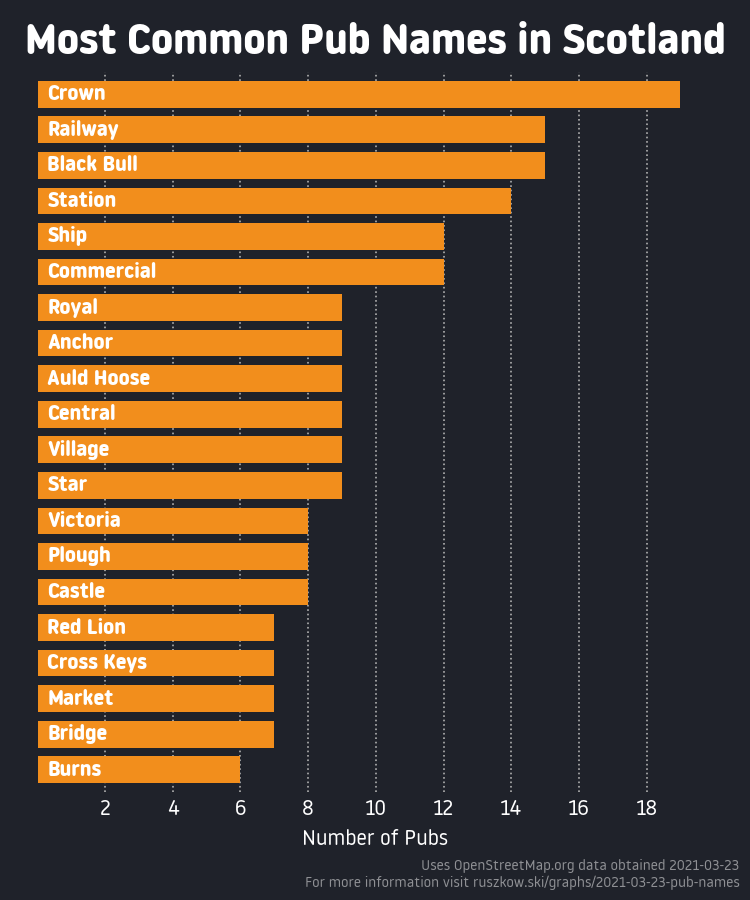
I’ve separated this out by each country in Great Britain, so here are the graphs for England and Wales, as well as the Scotland one up there in the header.
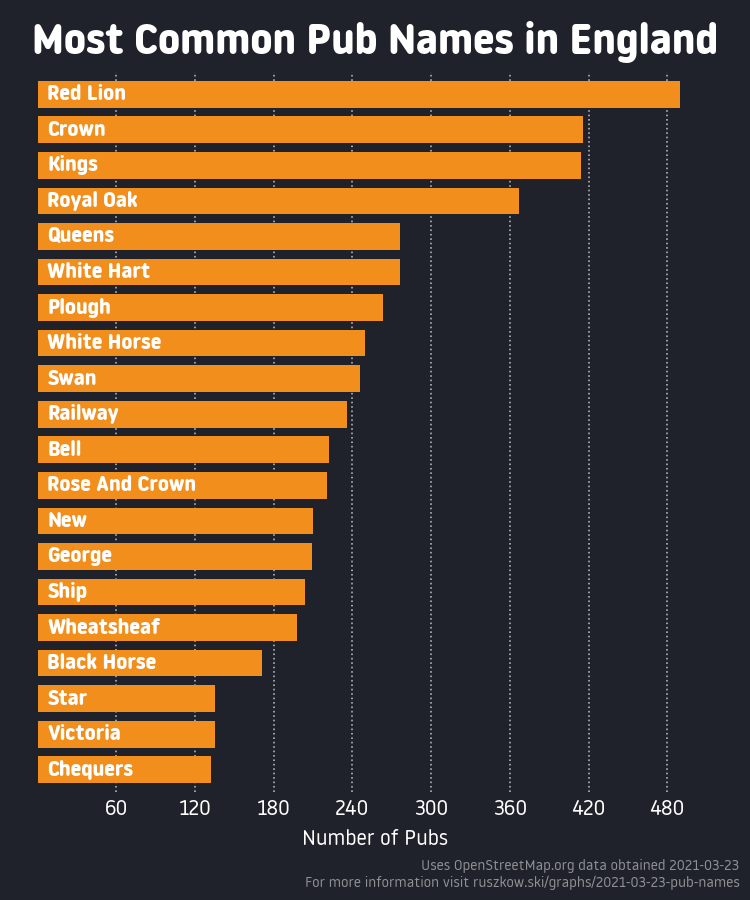
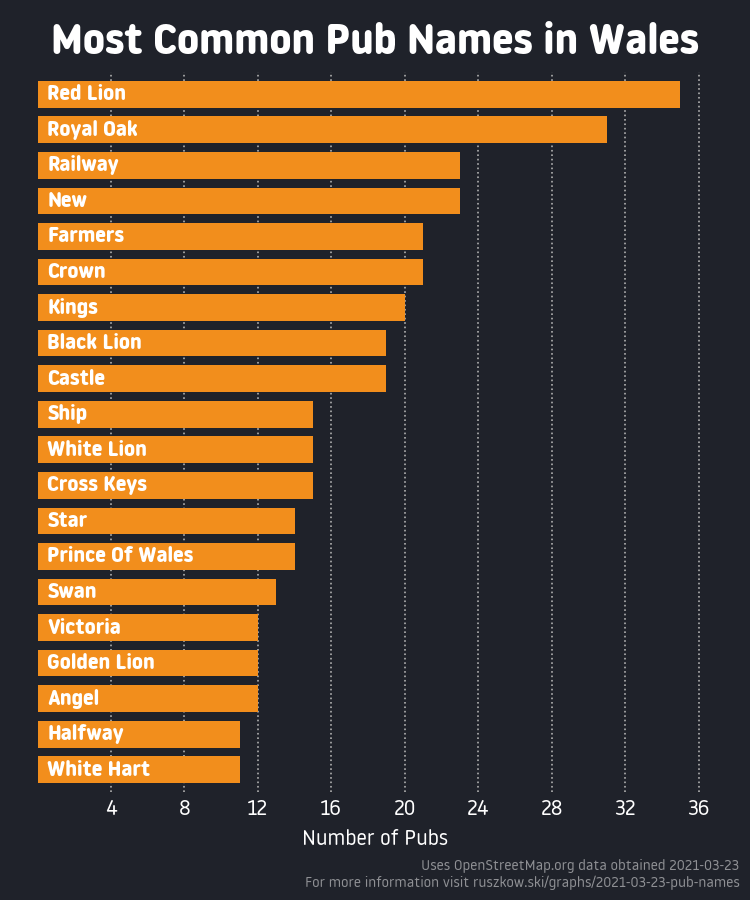
What’s telling here is the sheer number of pubs listed in the England graph compared to the other two. I’ll need to have a dig about to confirm that’s actually valid! Otherwise, I’m not surprised by Red Lion’s dominance in England (I grew up in the Midlands after all), nor Crown’s prominence in Scotland.
How?
First, we need to get the data. As always, OpenStreetMap provides a great source for geographical data. I used Geofabrik’s downloads to get all of the OSM data for each country, resulting in some pretty chunky files.
Getting the names of pubs is, in fact, one of the examples given in the pyosmium library, though this just prints all of the names. I adapted this to instead write nodes, ways and polygons for each country. It takes a little while to run through all of the files (again, they are pretty large) so I set this going in its own little script, and dealt with the processing and graphing separately.
The extracted locations can be read in extremely easily with geopandas. I only read in the points and polygons as the ways seemed to just provide outlines to the polygons themselves, resulting in a duplication of outputs. However, we do need both points and polygons as some pubs appear only as points and some only appear as polygons. Guess what though - some appear as both! To try and ensure we’re not counting these twice, we simply intersect the two layers and remove the points that are located within one of our polygons.
The last real bit of work that takes place is cleaning the names. I’ve taken out most of the common suffixes (“Arms”, “Hotel” and the like) as they’re not really a critical part of the name, removed “the” from the start of any name, replaced any & with the full “and” and converted to Title Case to make sure they’re fairly consistent. Phew. Once that’s done, it’s just a case of plotting!
Libraries / Resources
pandasandmatplotlibas usual for processing and plotting, withplot_stylesfor basic colourspyosmiumreally does make working with the bulk OSM downloads pretty straightforward, withshapelyused to simplify writing out the files andgeopandasto simplify reading them back in- This is basically a Noway Round tribute site these days and I’m not ashamed of it
Data Sources
- OpenStreetMap data for each country downloaded from Geofabrik
Code
Find it on GitHub