Halloween Timetable
What?
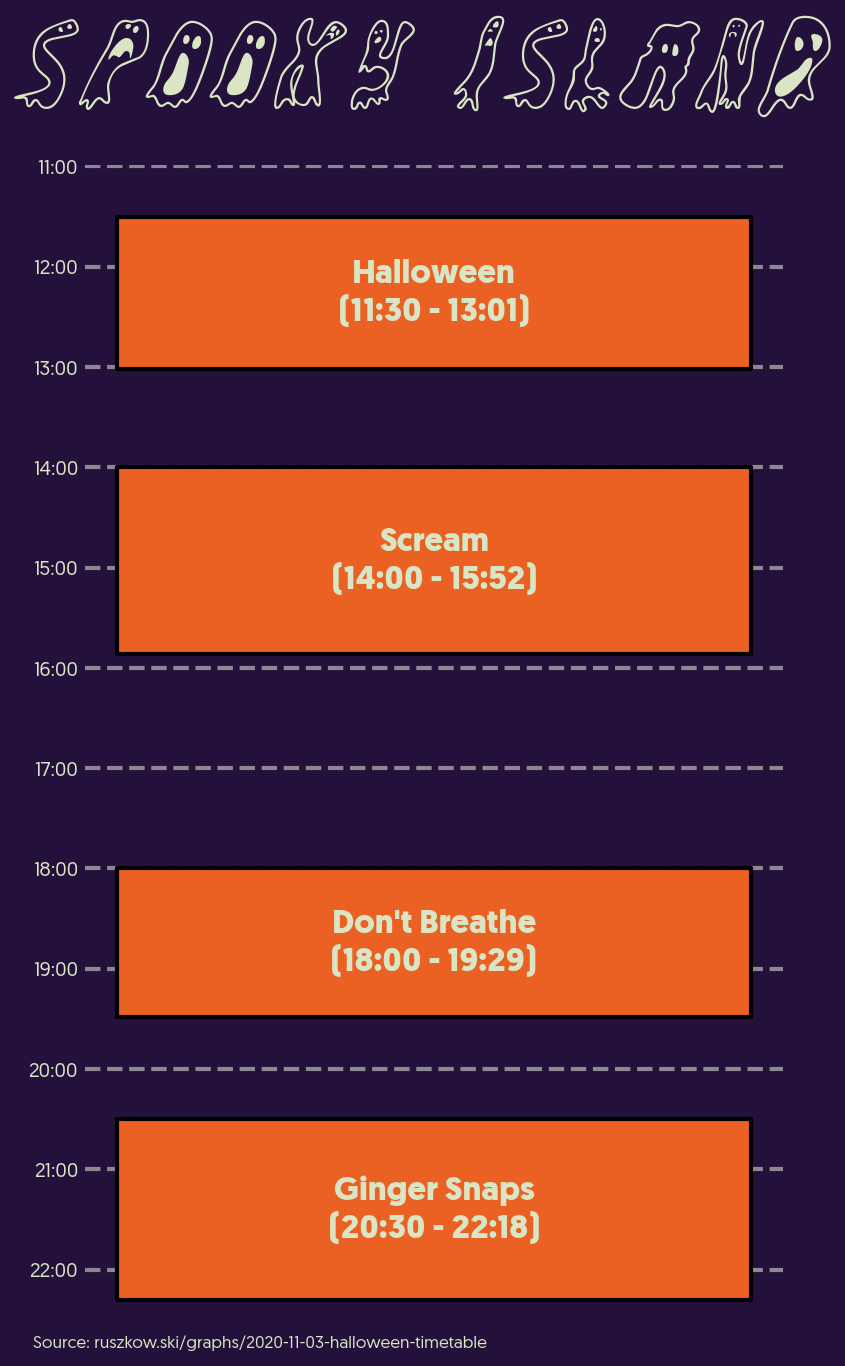
Generally, I’m not very into horror films - I’m just not that into getting scared, and I tend to scare quite easily. Spooky season is spooky season though, and when my pal Mike decided to run a vote to pick films for a Halloween movie marathon on our Discord server (thanks Mike!), I couldn’t help but make a timetable for it.
How?
Hello there matplotlib, my old friend. As if it would be anything else.
The fun part of this chart is using the Rectangle object to draw the different
film boxes - I don’t tend to work with the shape objects all that often, so it
was interesting to see how this ties in with the PatchCollection.
Libraries / Resources
matplotlibpandas- Geomanist once more (it’s more or less my go-to font now)
- “Groovy Ghosties”, a free font for the title
Data Sources
- I pulled the film durations from Letterboxd
Code
Find it on Github