Halloween Heartrate
What?
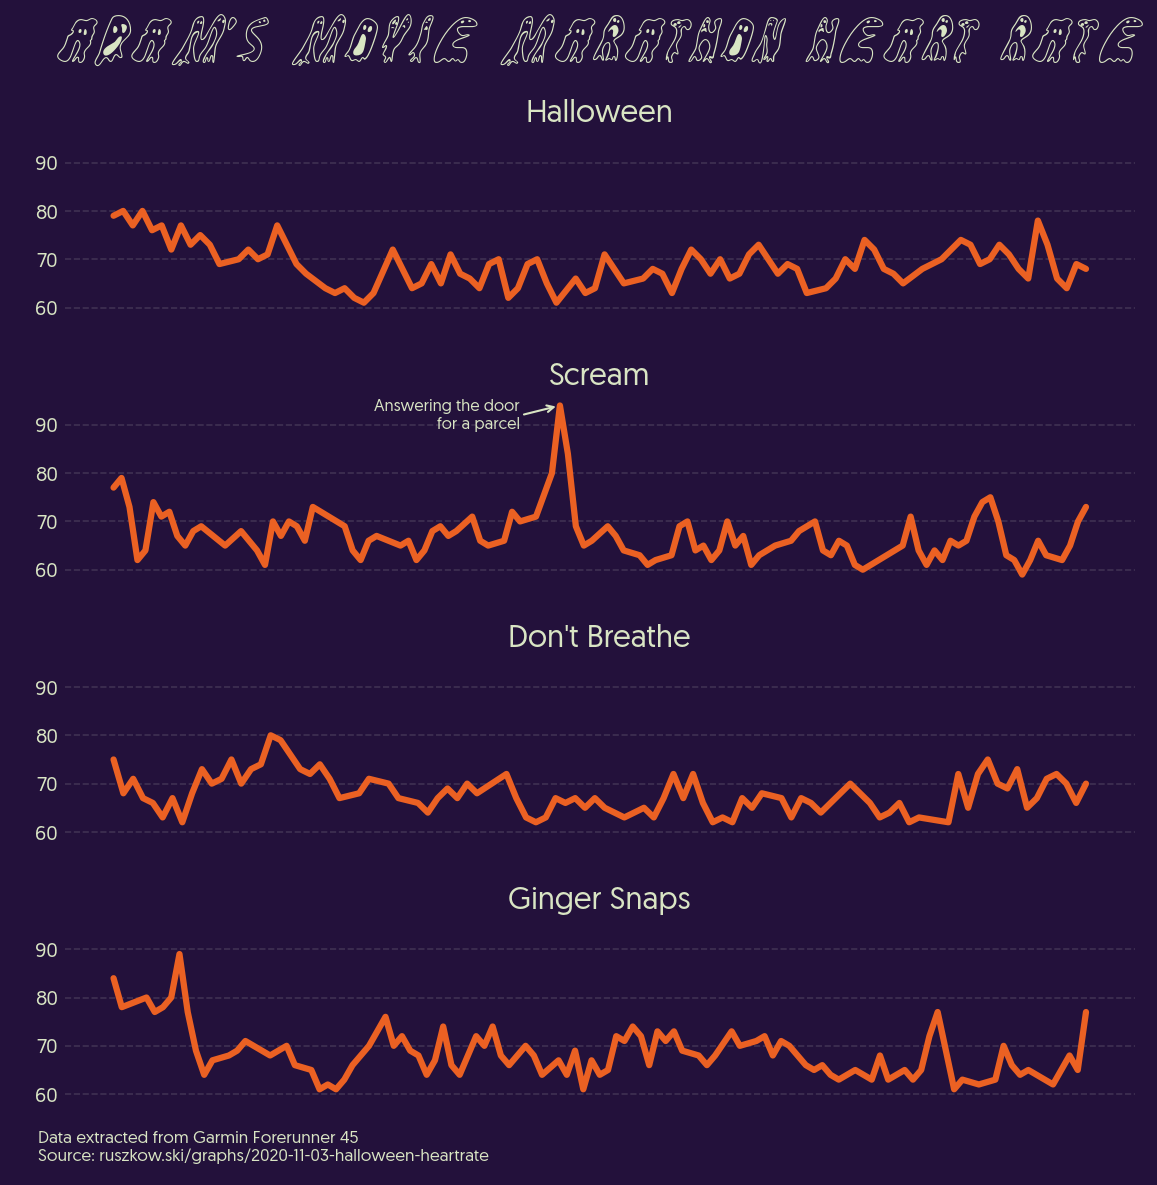
After watching the films I mentioned in my Halloween timetable graph, I realised that my watch would have been tracking my heart rate right the way through each film, and thought it might be fun to see if my heart rate had been particularly affected by any of the films.
On looking at the data, nothing seemed particularly out of the ordinary - except one massive spike during Scream. Thinking about it, this also happened to correspond to a parcel arriving at the flat - so the buzzer going managed to scare me more than any film. Sounds about right.
How?
This was surprisingly fiddly to do. fitparse is a great library, but it’s
geared towards “activity” recording, rather than passive data recording. That
made finding the right fields for the timestamps a bit difficult, and then those
in turn are stored in quite a confusing way. I wouldn’t have been able to get
the times out properly without the help of a rather excellent Stack Overflow
answer, but thankfully once that was done the rest of it was relatively
painless.
Libraries / Resources
matplotlibpython-fitparse, a library for parsing the files that come directly from Garin watches.pandas- Geomanist once more (it’s more or less my go-to font now)
- “Groovy Ghosties”, a free font for the title
- This excellent Stack Overflow answer about converting Garmin timestamps to “human-readable” ones.
Data Sources
- I pulled the heartrate data directly from my watch - a Garmin Forerunner 45
Code
Find it on Github