Download Headliners
What?
The first festival I ever went to was Download at Donington Park, in 2005. My dad and I returned in 2006 and 2007 - he’s been back a few more times since, I’ve not but it still holds a special place in my heart.
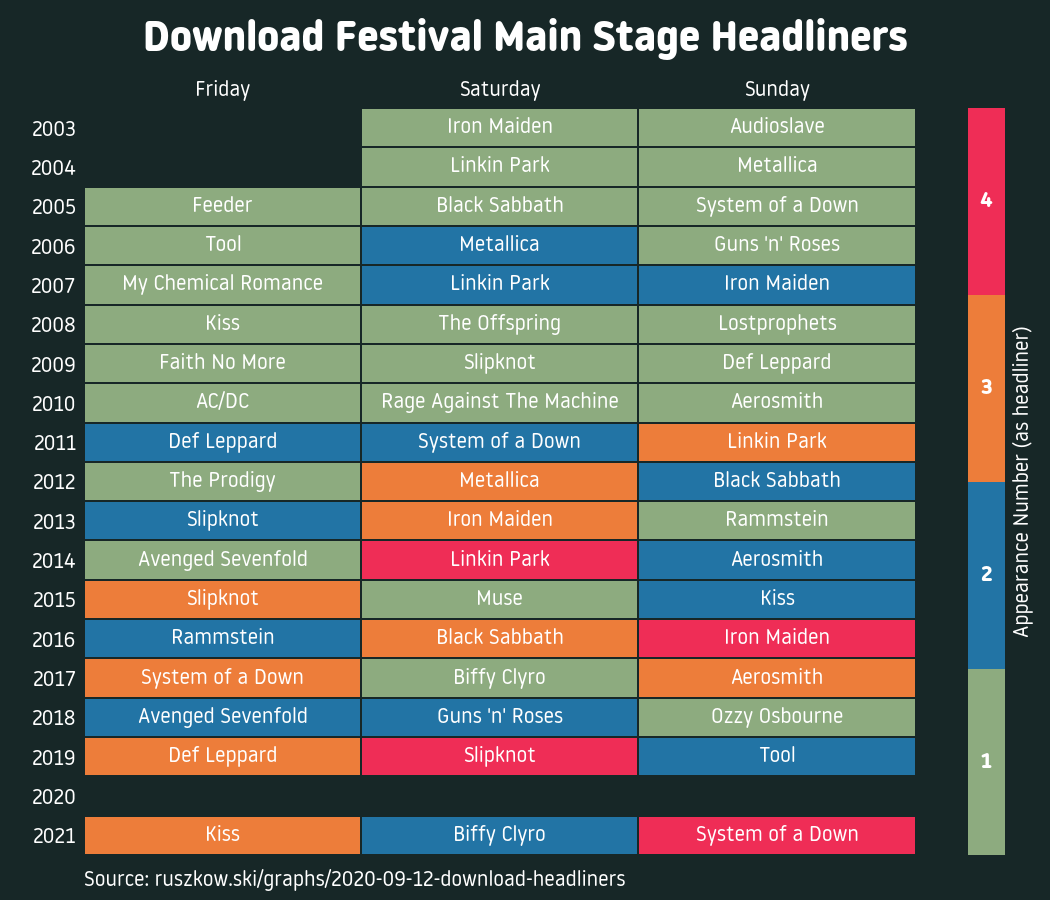
One criticism that gets levelled at the festival is that its headliners tend to be taken from a small pool of bands, so I decided to actually graph it. What we see is that from around 2011 onwards new main stage headliners become decidedly less frequent, with one new headliner at most appearing in a given year.
Something I noticed after producing this graph was that the bands looked decidedly male, so I decided to recreate the graph but only showing bands containing non-male members.
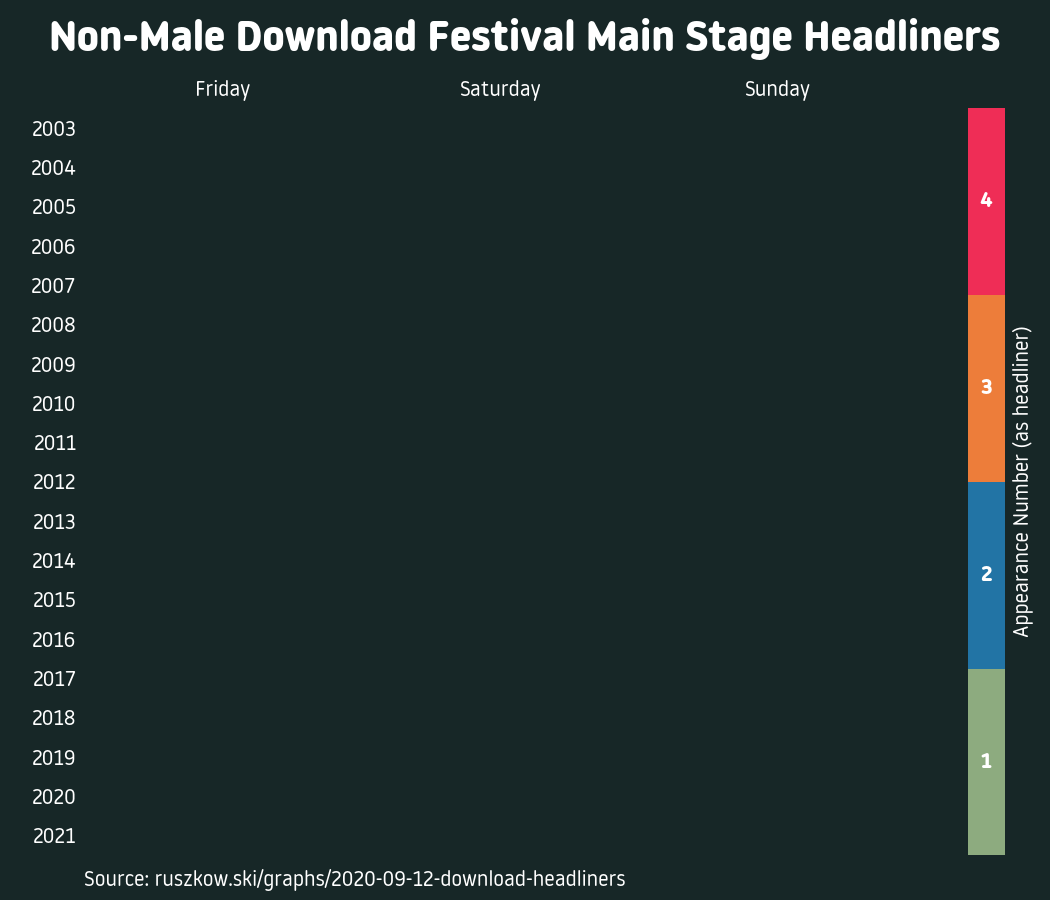
Yep. Download’s headliners across its 17 years (plus the announced headliners for 2021) have never featured someone non-male. This is genuinely maddening, and something Download needs to do better with.
I realise that as a white man, I am not the best person to talk to about this so if this is something you’re interested in (and you should be), then some additional resources can be found via:
Thanks to my good pal Beth of Glasgow’s finest Slowlight, 10am, Flinch and many other great bands for these references.
How?
seaborn truly does make producing heatmaps from pandas DataFrames very easy.
As usual, there’s a lot of fiddly bits for getting things just right - removing
tick marks, moving labels around etc. In particular here,
LinearSegmentedColormap from matplotlib was really useful in getting
distinct colours for the different count values.
Libraries / Resources
matplotlib, my one true love, withseabornfor ease of producing heatmaps.- Who loves Atipo fonts? Adam loves Atipo fonts. Noway Round again here.
Data Sources
- I copied the headliners out manually from Wikipedia. There are probably ways to automate that, but it wasn’t enough data to be worth the effort.
Code
Find it on Github