UK Bisexual Population
What?
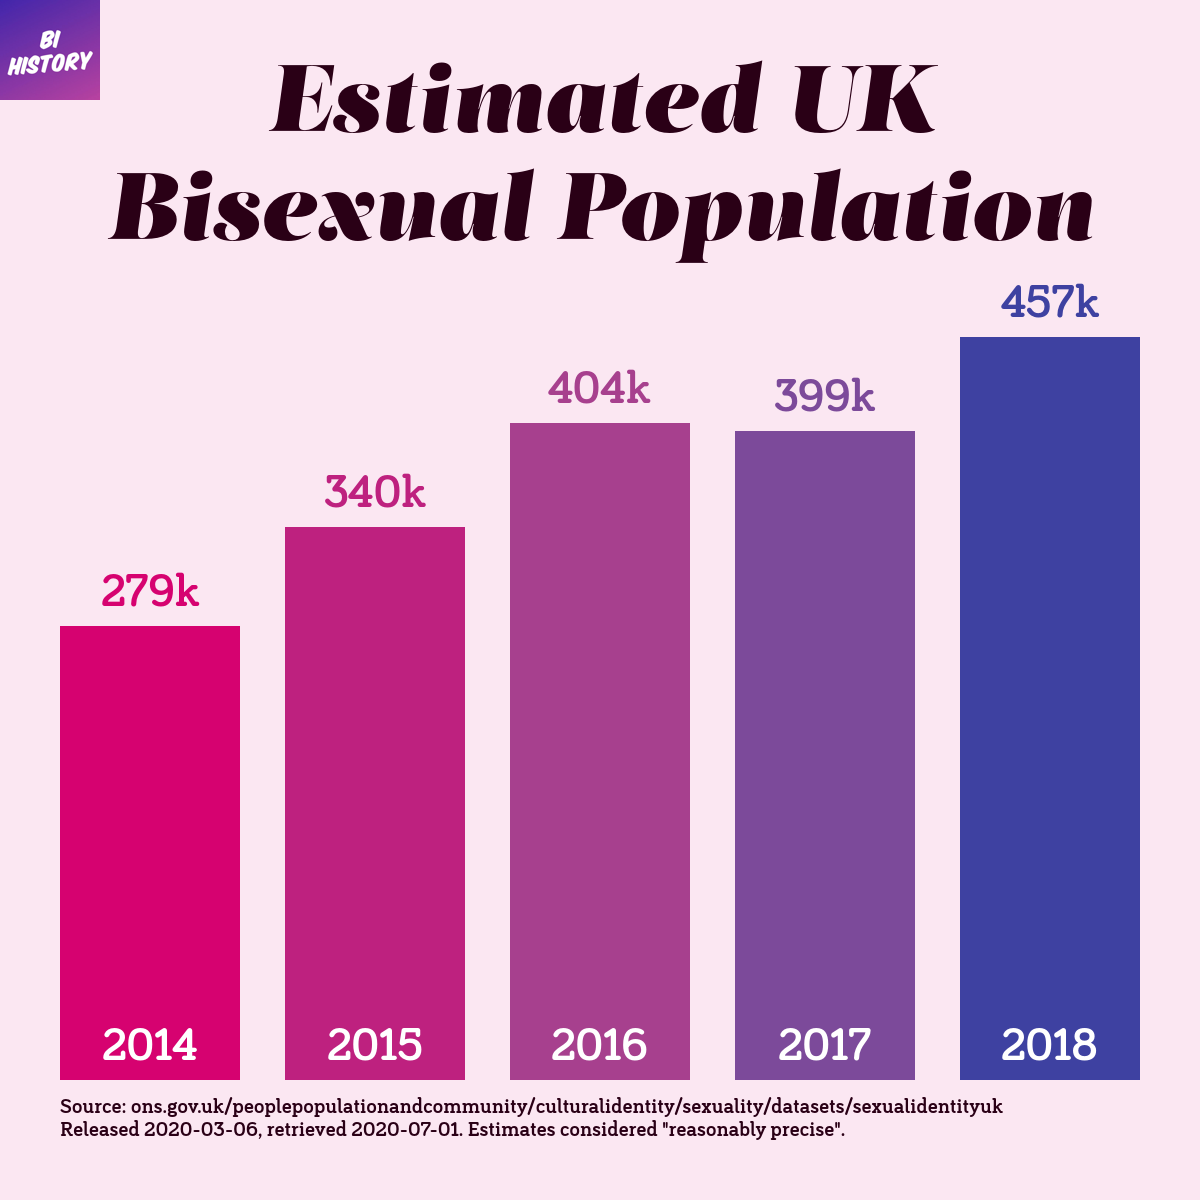
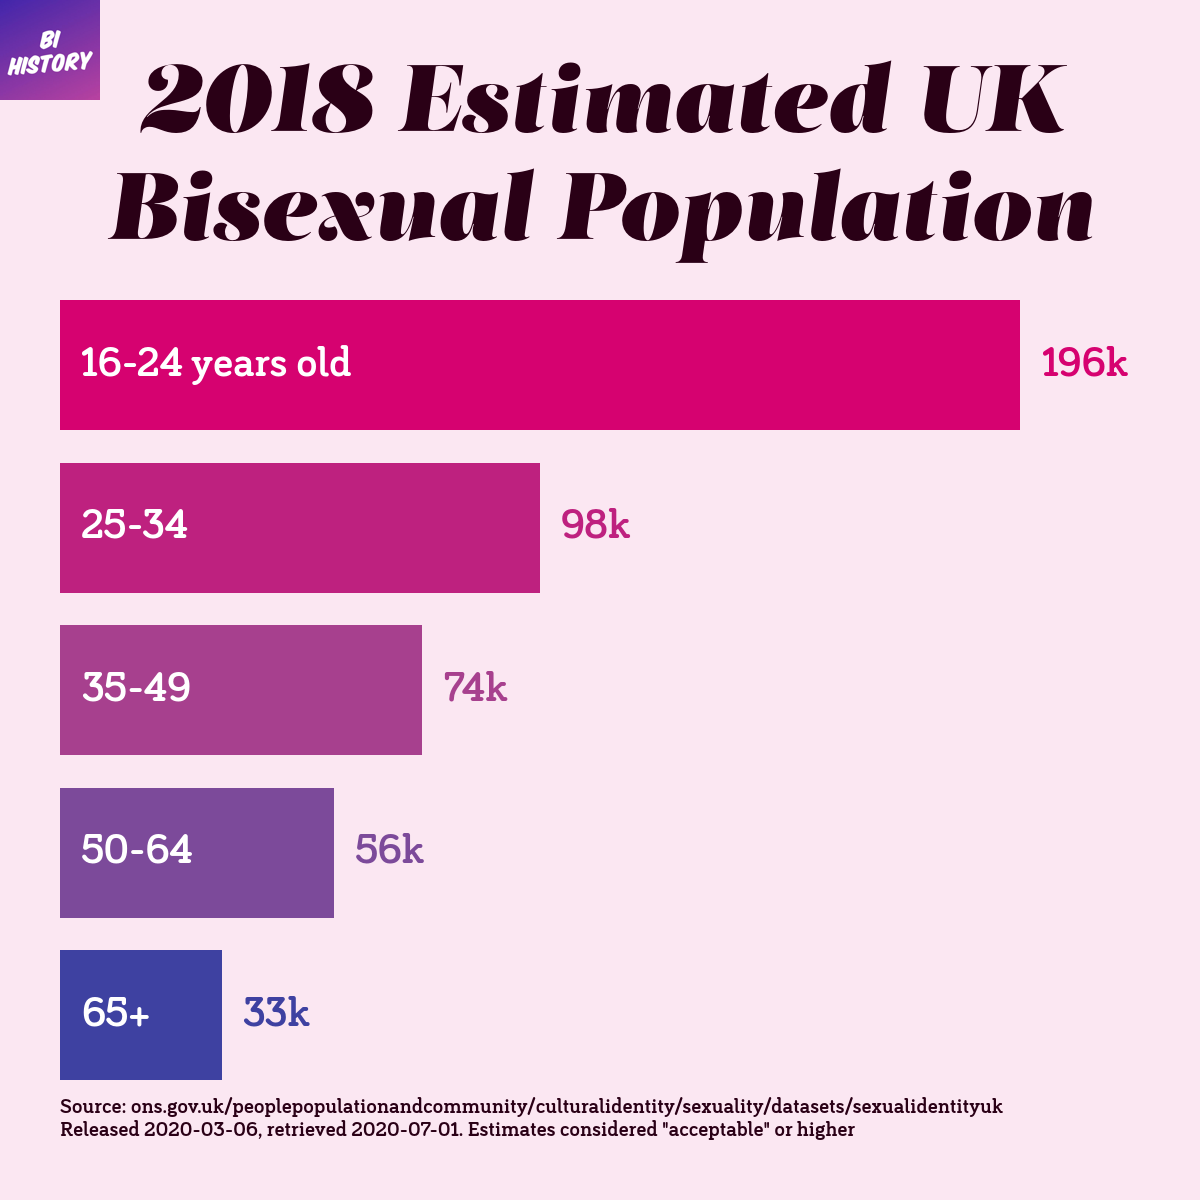
Some friends of mine run the excellent Bi History Instagram account that provides useful information and resources about bisexuality. I’ve been trying to think of a way I could produce some nice graphs for them, but sadly there seems to be a dearth of good, reliable data sources on this topic. There is, however, an ONS survey on “Sexual Orientation” that provides estimates of the UK’s LGB population across various classifications. The sections offering the most interesting and “reliable” (ONS’ definition, not mine) populations for bisexuality were the total UK population by year, and the population by age group for the latest available year of 2018.
How?
As with a lot of my graphs recently this is just a well-labelled bar plot, but
there were a few new matplotlib features for me here.
Adding the watermark for the account required use of fig.figimage
and making sure it stayed in the correct position between drawing and saving
required setting plt.rcParams['figure.dpi'] to the same as our output DPI.
Additionally, I used a LinearSegmentedColourmap
in two separate places. First, to colour the bars with the bisexual flag colours
(which look absolutely lovely here), and secondly to set our supporting colours.
The background colour is a very lightened form of the pink of the flag, and the
text is a darkened form. I think this gives it some nice aesthetic consistency.
For a bit of extra fun, while prototyping the yearly graph I saved it with a full time and date stamp at each stage (the age group graph largely used the same code so this is much less interesting). This lets us see the full development of this graph, from as basic bar chart to our final image.
Libraries / Resources
matplotlib- Some more lovely fonts from Atipo:
- Salomé for the title
- Bariol Serif everywhere else
Data Sources
- HTML codes for the bisexual flag colours came from Wikipedia
- As mentioned earlier, I used the ONS’ “Sexual Orientation” dataset, released 2020-06-03
Code
Find the main processing code on Github
To create the gif seen above, I used ImageMagick and the following command prompt:
magick convert -delay 1x5 2020*.png -delay 400 "20200701 221149.png" output.gif
This sets the frequency to 5 frames per second and then adds a large delay for showing the final image again.