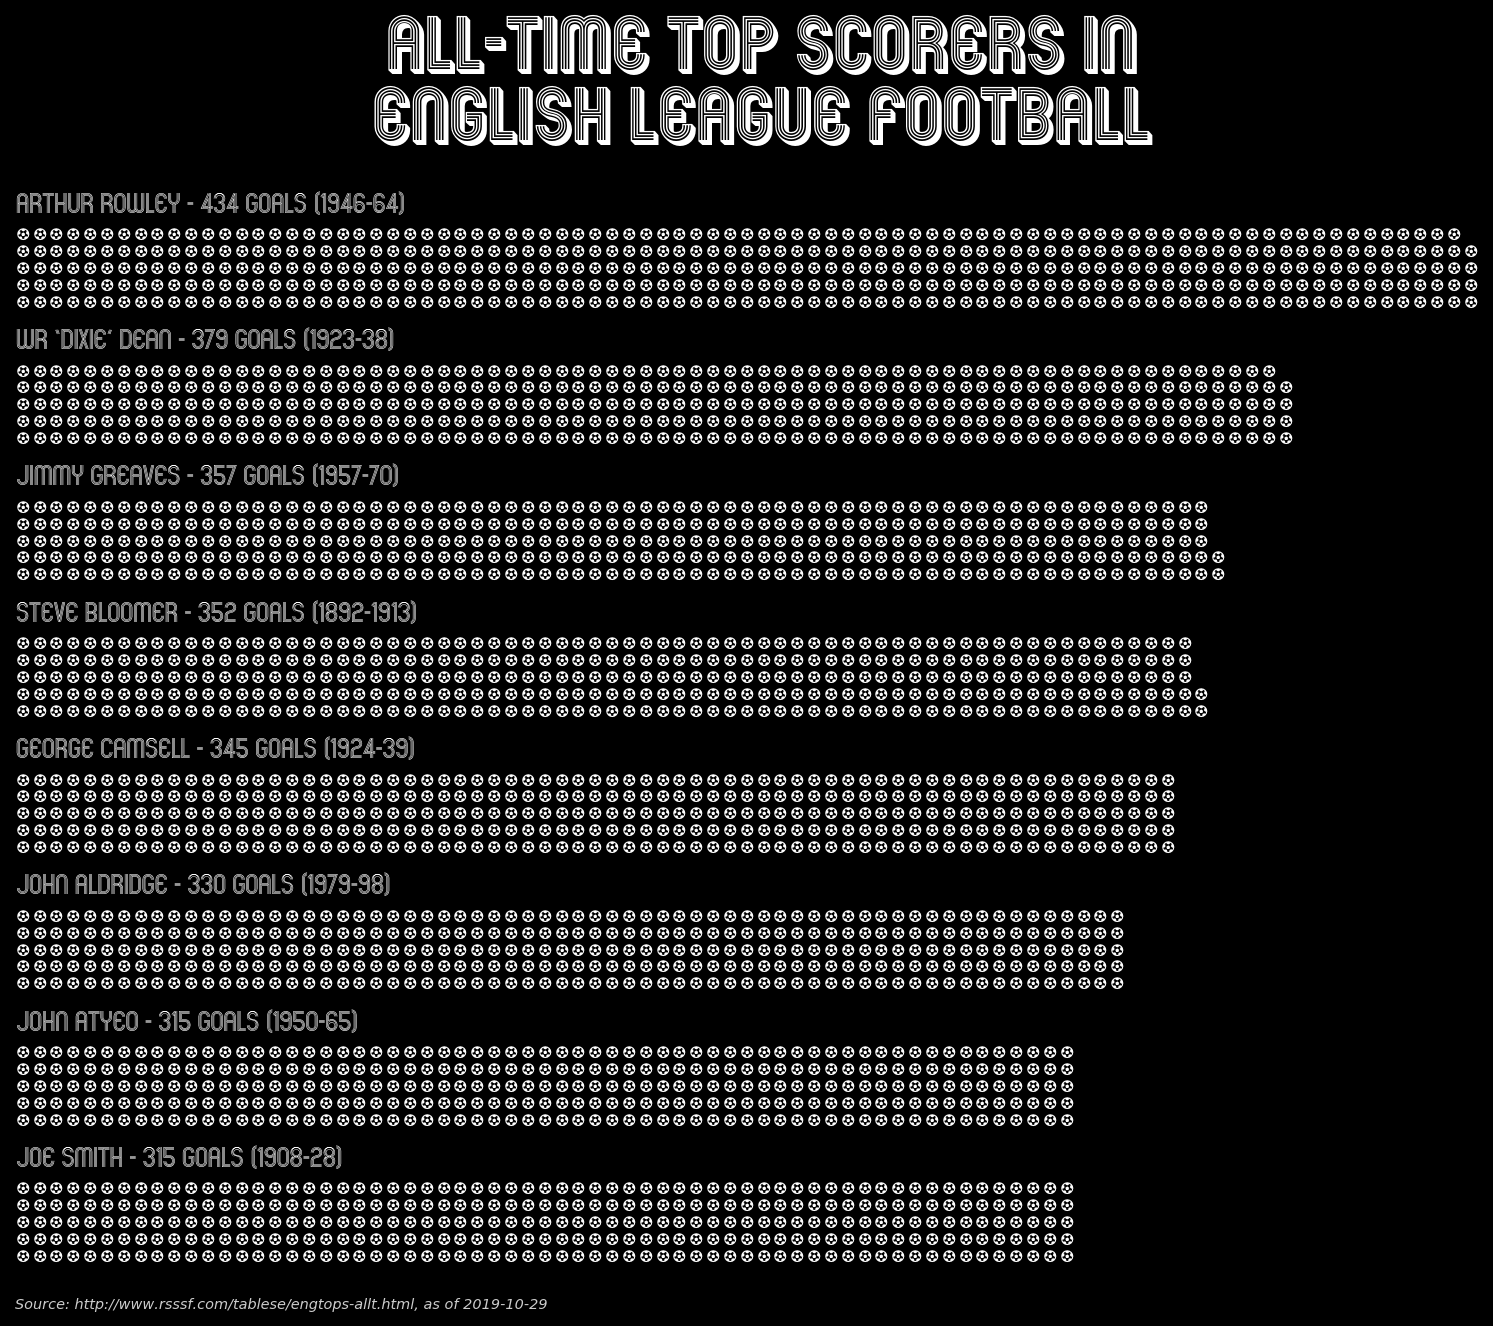
English Football’s Top Goalscorers
What?
The top 8 all-time goalscorers in English football. Why 8? Well, I wanted to do
the top 10 but couldn’t get PyWaffle to play well with subplots and 10 or
more figures. Plus, nobody wants to see 9 figures, so 8 it is.
How?
The “What” section kind of gave this away, but it comes through using subplots
in PyWaffle, as suggested by the docs.
The main issue with this was trying to use the flat version of the font for the
individual waffle titles and the 3D font for the main header. The issue is that
when installed, the font shows as two separate “faces” in Windows. I couldn’t
work out how to get matplotlib to distinguish between the two, so as a
workaround I just linked directly to the fonts.
Libraries / Resources
matplotlibPyWaffle- Mexcellent, a font available for free
Data Sources
- The rather excellent RSSF provided all of the data used here
Code
Find it on GitHub