NFL Injury Data
Update 2021-04-30: Graphs updated with 2020 data, and a nicer font (Bariol, from Atipo Foundry) Update 2020-02-16: Graphs updated with 2019 data
What?
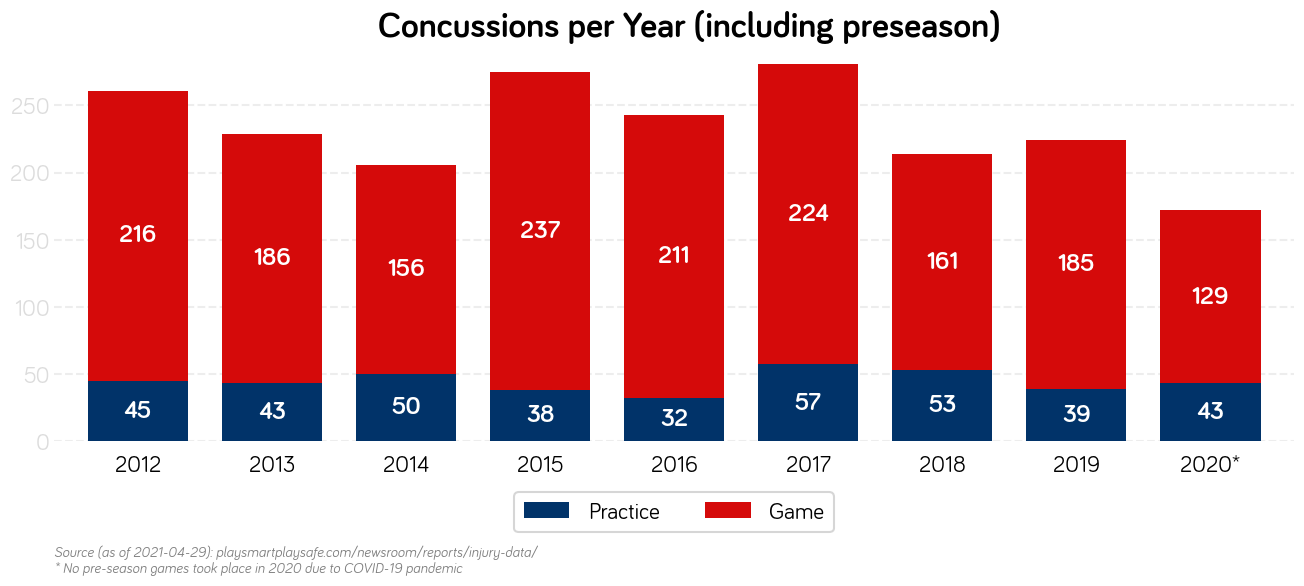
The NFL puts out injury data each year, covering three areas. The cover image for this post provides the headline stat of concussions, but information is also provided for ACL Tears:
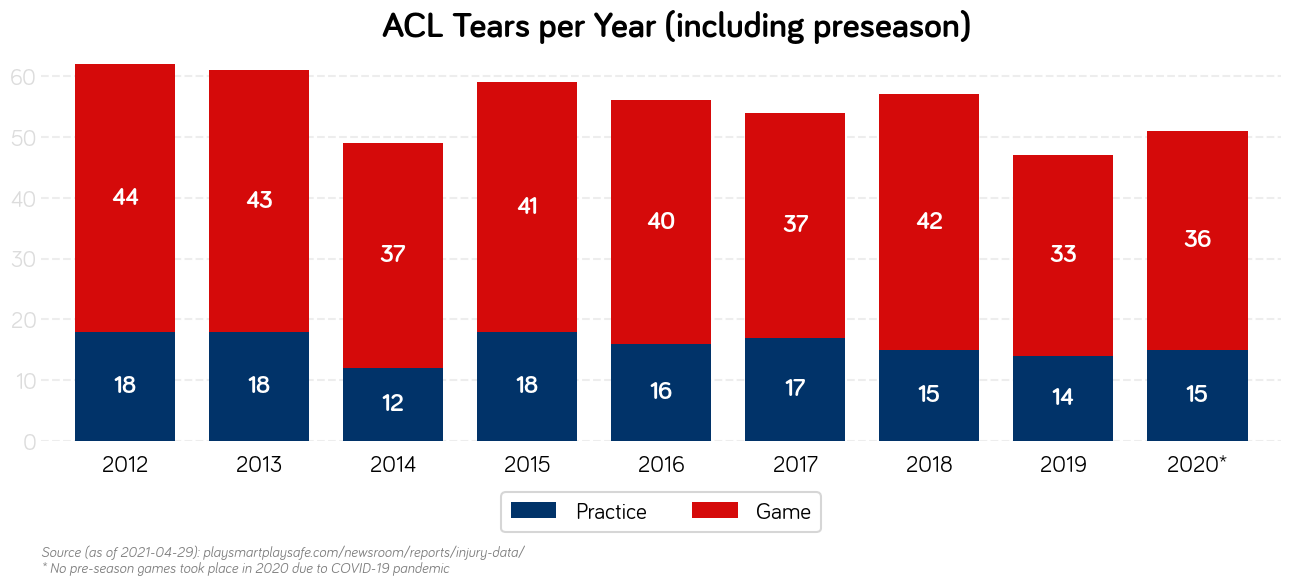
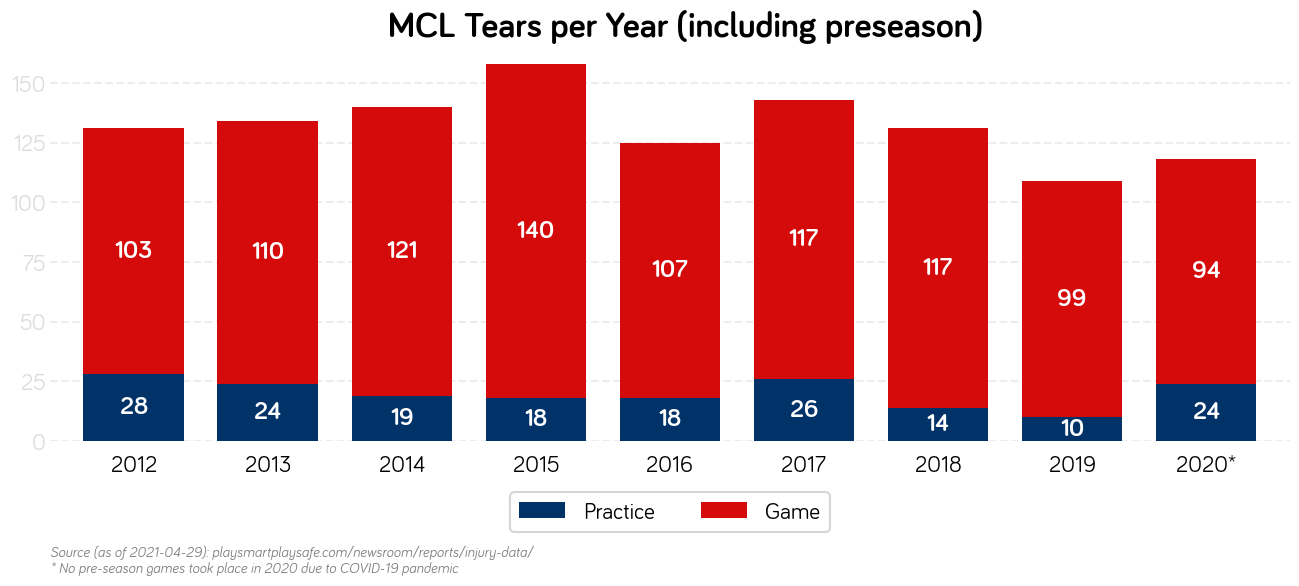
and MCL Tears:
How?
A stacked bar chart in matplotlib, with a bit of post-processing to make the
graphs look nice. Honestly, the biggest hassle involved in making these graphs
was getting the data itself, as the NFL inexplicably only seems to embed the
values as images.
Libraries / Resources
pandasmatplotlibseaborn(only for figure aesthetics)- NFL logo colours as detailed on a site called SchemeColor
Data Sources
As noted in each image, the injury data comes directly from “Play Smart Play Safe”, the NFL’s own website for player health data. Seems a slightly inappropriate name considering they’re seeing over 200 reported concussions each year.
Code
Find it on Github