Astronauts
Update 2019-10-22: PyWaffle version updated to allow use of vertical
What?
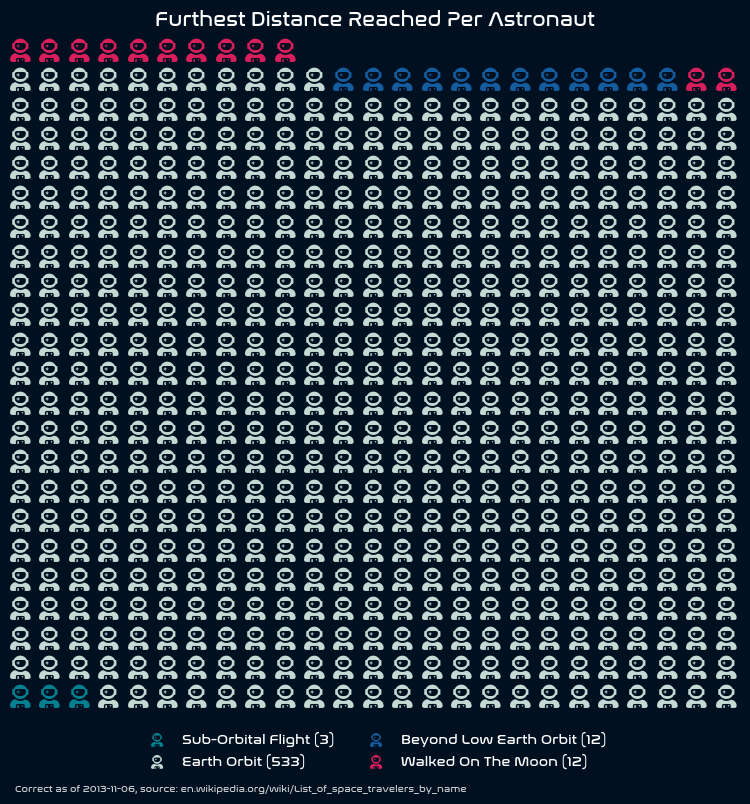
A waffle chart showing the number of astronauts to have achieved distance milestones in space.
Space is cool, humans travelling in space is extra cool and this gives an interesting way to see that a perhaps surprisingly large number of humans have travelled to space, though very few have actually set foot on the moon.
It was somewhat difficult to find precise details about this - hence the slightly old date associated with the values. This is my best interpretation of what’s on Wikipedia.
How?
Nothing fancy here - a manually written dictionary and a short bit of pywaffle
code.
Libraries / Resources
matplotlib(I used 3.1.1)pywaffle(>0.4.0)- Nasalization Regular to get the labels looking just right, available free from Fontspring
Data Sources
As noted earlier and on the graph itself, the data here comes from Wikipedia.
Code
import matplotlib.pyplot as plt
from pywaffle import Waffle
import matplotlib.font_manager as font_manager


# Update font list
font_manager._rebuild()

plt.rcParams['font.family'] = 'sans-serif'
plt.rcParams['font.sans-serif'] = 'Nasalization'
plt.rcParams['savefig.facecolor'] = '#001021'
plt.rcParams['text.color'] = 'w'

data = {
    'Sub-Orbital Flight': 3, 'Earth Orbit': 533,
    'Beyond Low Earth Orbit': 12, 'Walked On The Moon': 12
}

SOURCE = ('Correct as of 2013-11-06, '
          'source: en.wikipedia.org/wiki/List_of_space_travelers_by_name')

fig = plt.figure(
    FigureClass=Waffle,
    rows=23,
    values=data,
    colors=('#028090', '#C6D8D3', '#145C9E', '#D81E5B'),
    labels=["{0} ({1})".format(k, v) for k, v in data.items()],
    legend={
        'loc': 'upper center',
        'bbox_to_anchor': (0.5, -0.02),
        'ncol': len(data) // 2,
        'framealpha': 0
    },
    icons='user-astronaut',
    icon_legend=True,
    icon_size=17,
    starting_location='SW',
    figsize=(8, 8),
    facecolor='#001021',
    vertical=True
)

plt.title(
    'Furthest Distance Reached Per Astronaut',
     size='x-large', weight='bold'
)

plt.text(
    fig.subplotpars.left*.6, 0, SOURCE,
    fontsize='x-small', style='italic', ha='left', va='baseline',
    alpha=.8,
    transform=plt.gcf().transFigure
)

plt.subplots_adjust(bottom=0.05, right=20)

plt.savefig('astro.png', bbox_inches='tight')