Album of the Year 2021
Every year, top champ Pip runs a Facebook group to work out the Album Of The Year within an extended friendship group. For the past few years I’ve been making graphs to summarise the results, using some slightly clunky Jupyter notebooks. At first this just analysed the albums chosen by the group, and then last year (after I did my TTNG analysis) I expanded it to include some Spotify data too.
All of the charts for each year can be found on Github here. I find myself gradually tweaking (and hopefully improving!) the code each year, but it’s definitely a bit bolted together so I won’t bother going into too much detail about it here. There are two graphs I wanted to talk about a bit more, which is why this post exists! I strongly recommend loading each in a new tab and zooming in to have a closer look.
Album Radar Plots
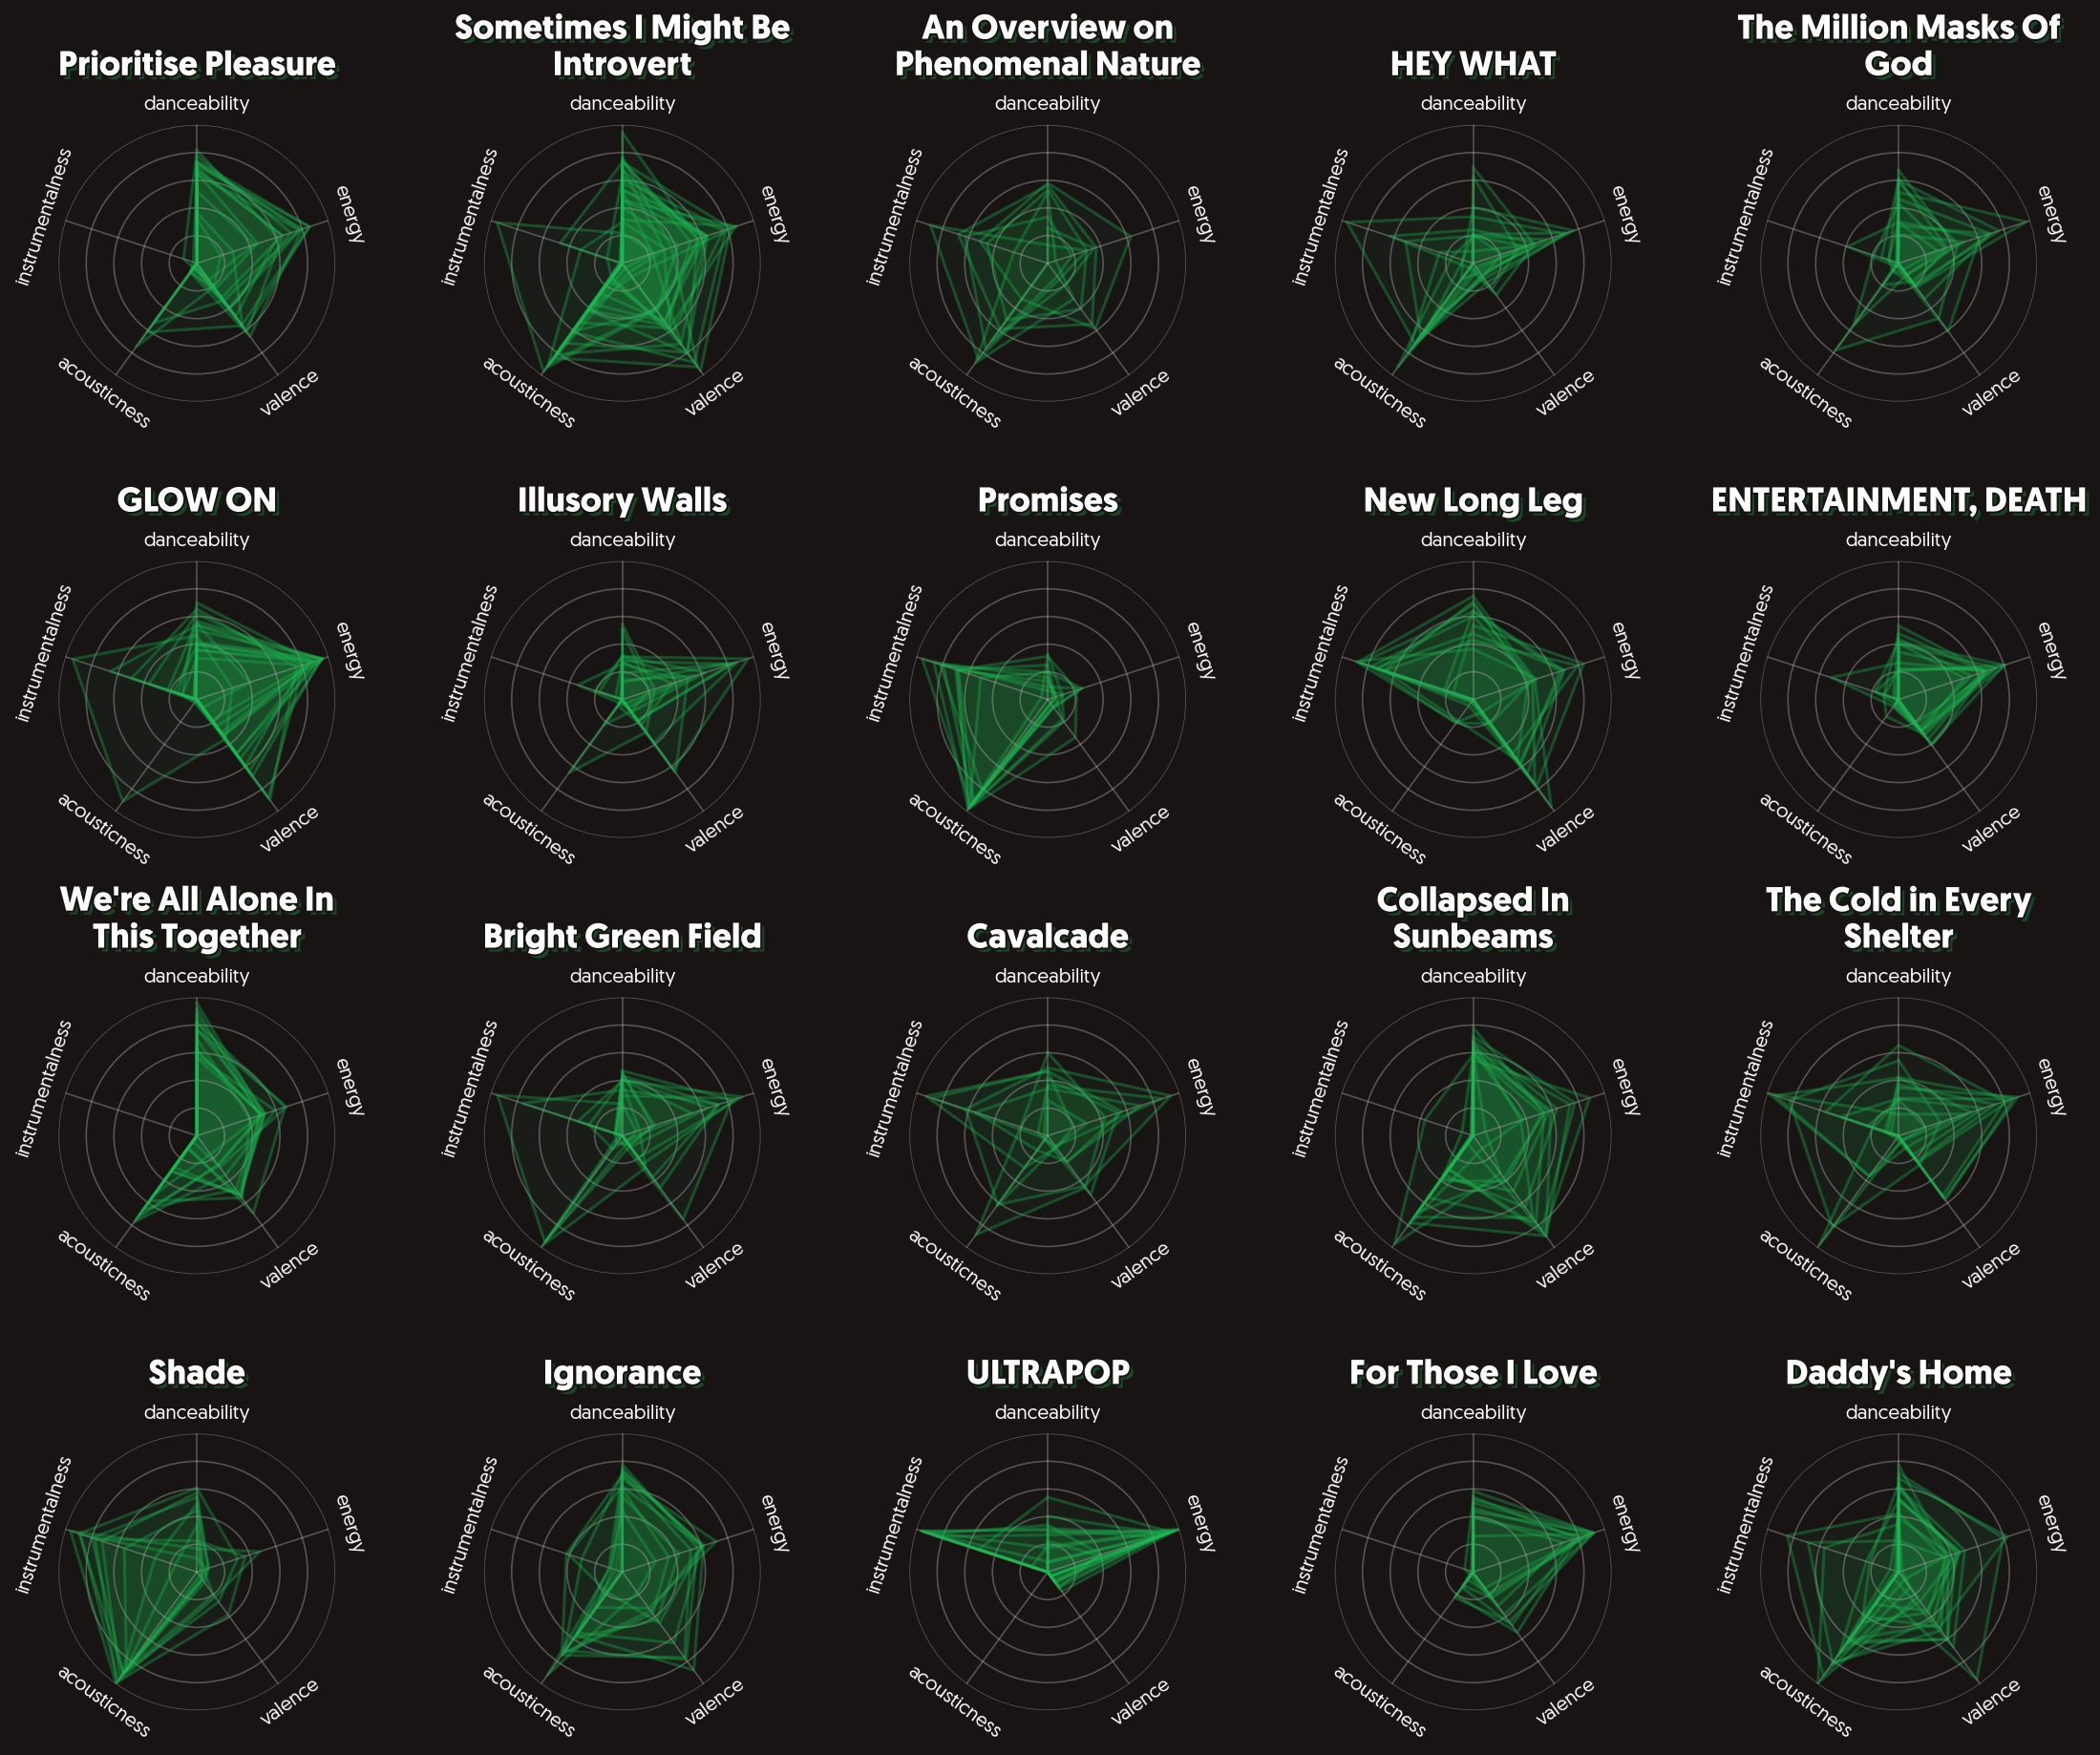
Inspired by the classic Pro Evolution Soccer radar charts of player stats, this chart shows various attributes of each song on each of the top 20 albums from the group. The values are taken directly from Spotify - “valence” is a bit of a weird one, as this is meant to indicate some kind of “musical positiveness”. These charts don’t really tell you anything interesting about the individual songs on each album, but do give you a decent sense of the overall feel.
My favourite albums of 2021
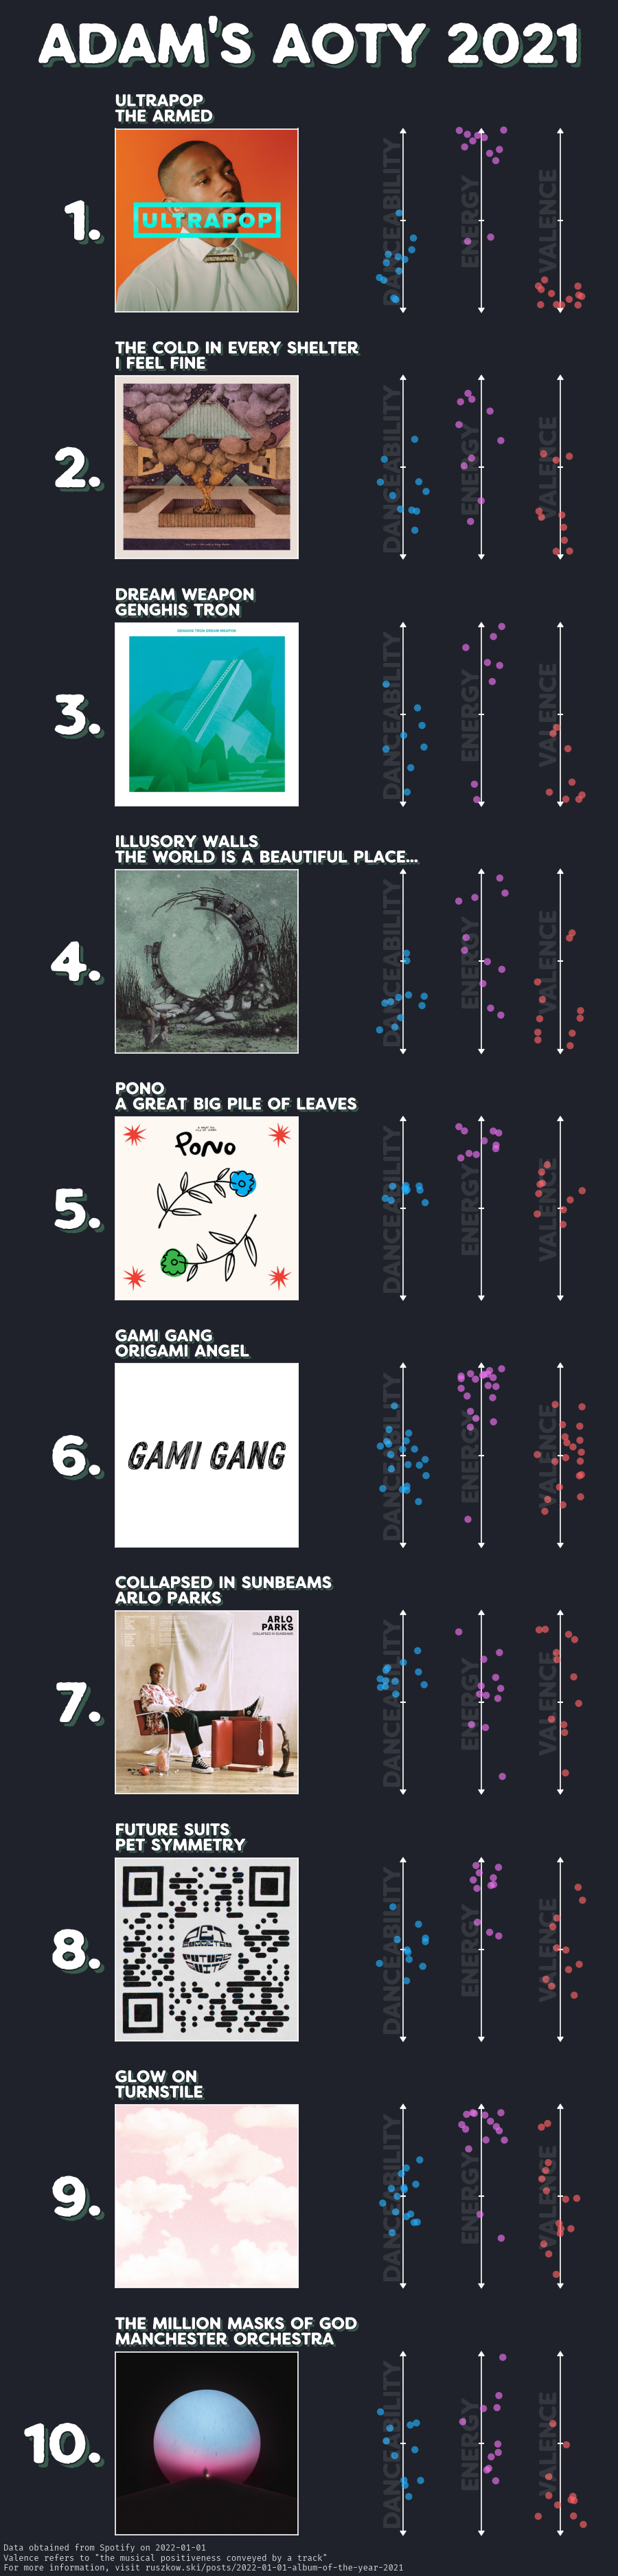
This rather long image shows my personal top 10 albums of 2021 (really, open it in a new tab and zoom in). It’s… not wholly surprising that I liked a lot of high-energy albums, as I tend to listen to a lot of music while working and sometimes motivational stuff can help.
One neat thing I learned from making this chart (which I then used in the radar plot) is that by stacking the path effects for text in matplotlib to be:
- Shadow
- Stroke matching the background colour of the image
- The text itself
It makes the text stand out quite nicely. Using the background colour for the stroke makes it that little bit more prominent while also allowing us to switch between styles easily without having to pick a new colour.