Dance, Dancier, Danciest
Back in the heady days of 2008, Oxford’s finest math-rock band TTNG (back then still known as This Town Needs Guns) opened their self-titled release with a (fantastic) song providing a rather curious declaration - 26 Is Dancier Than 4.
Jump forward 12 years to 2020, and I’ve been digging around a bit in the Spotify API to better understand what data it provides and try to find some fun things to plot. In doing so, I spotted (geddit?) that within the object model, every track has a series of attributes, one of which is called danceability.
Danceability. Such an unknowable concept has been distilled down by Spotify to a single number between 0 and 1. If you’re anything like me, this concept immediately brought up the idea that we’d use this to verify the statement provided by TTNG, namely:
Is 26 dancier than 4?
But, alas, Spotify doesn’t provide the danceability analysis for numbers alone, only songs. So instead, we can ask a slightly different question:
How danceable is 26 Is Dancier Than 4?
Is this a strangely convoluted excuse to make some graphs? Sure. Just go with me on this one.
But what does the number mean?
Right okay. We should probably have at least some sense of how the danceability value is calculated. Fortunately, Spotify provides one in its documentation:
Danceability describes how suitable a track is for dancing based on a combination of musical elements including tempo, rhythm stability, beat strength, and overall regularity. A value of 0.0 is least danceable and 1.0 is most danceable.
This differs somewhat from my own stance on what makes a song danceable (stable rhythms are for cowards) but this is what we have to work with.
First, let’s look at how 26 Is Dancier Than 4 compares to other tracks on This Town Needs Guns.
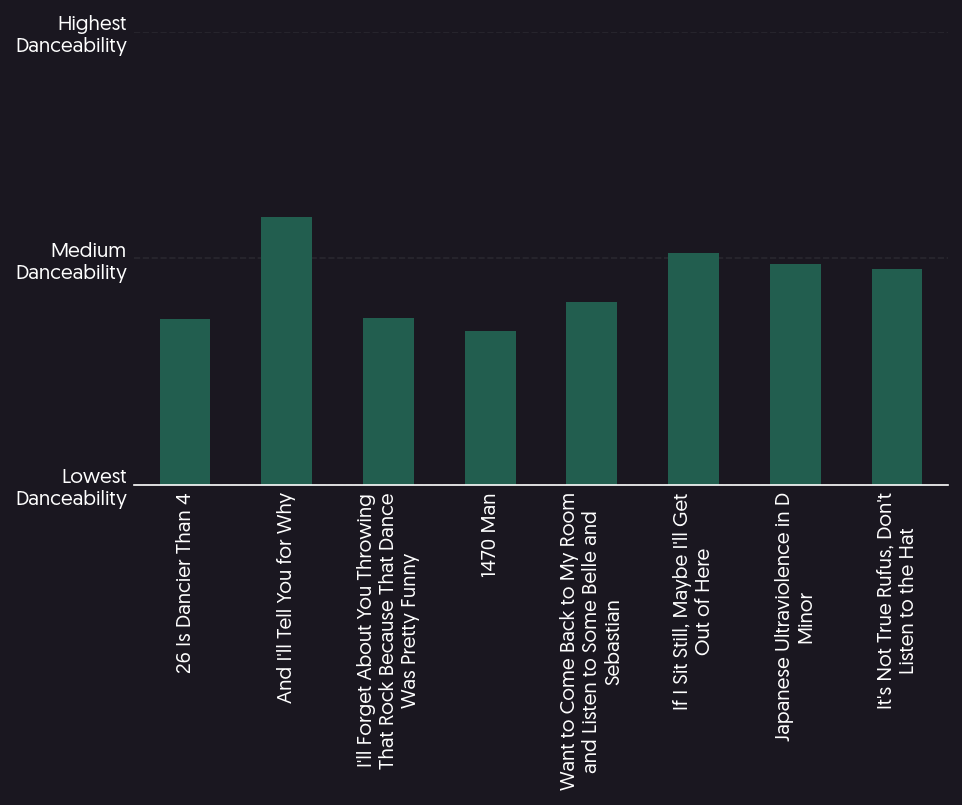
Oh. So, it appears that 26 Is Dancier Than 4 is not very danceable. Moreover, there are several more danceable tracks on this release alone. Maybe instead we should try to find the most danceable TTNG track. But as I mentioned earlier, I don’t think Spotify’s rating of danceability quite works for me, so I think we should look at another attribute Spotify assigns to each track - energy. This is defined by Spotify as follows:
Energy is a measure from 0.0 to 1.0 and represents a perceptual measure of intensity and activity. Typically, energetic tracks feel fast, loud, and noisy. For example, death metal has high energy, while a Bach prelude scores low on the scale. Perceptual features contributing to this attribute include dynamic range, perceived loudness, timbre, onset rate, and general entropy.
That feels a bit more like it. High energy would make me want to dance. Let’s instead plot the danceability and energy of every TTNG song. I’ve added labels to the tracks with the highest and lowest rating for each measure.
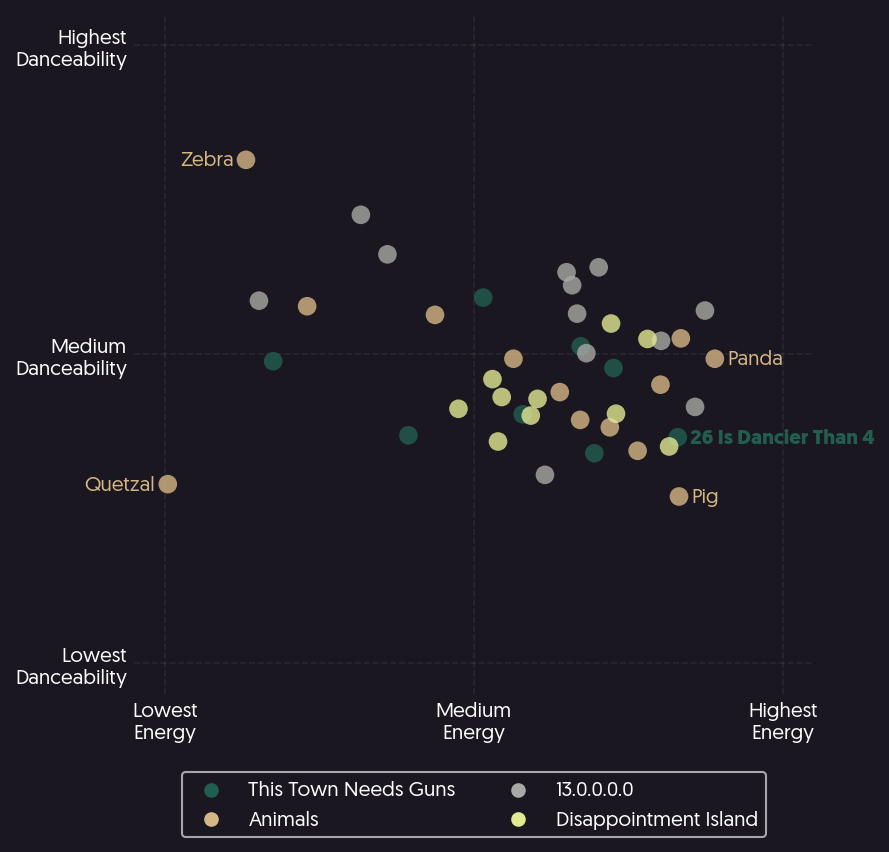
Now this is a little more interesting - 26 Is Dancier Than 4’s high energy makes up somewhat for its low danceability. It’s interesting to see that all of our extremes come from the same release (2008’s stellar Animals) and that TTNG’s songs are generally high-energy (that definitely checks out).
What conclusions can we draw from this though? I’ll give you two. Firstly, if we just use our most extreme values then we can safely declare that:
Zebra Is Dancier Than Quetzal
Which, I’ll be honest, has a fairly nice ring to it. One other thing that we can read off this graph that also fits my desire for high energy to dance gives us something much more fun to use though. May I instead provide my own curious declaration:
Panda Is Dancier Than 26 Is Dancier Than 4