Sunshine on Leith
What?
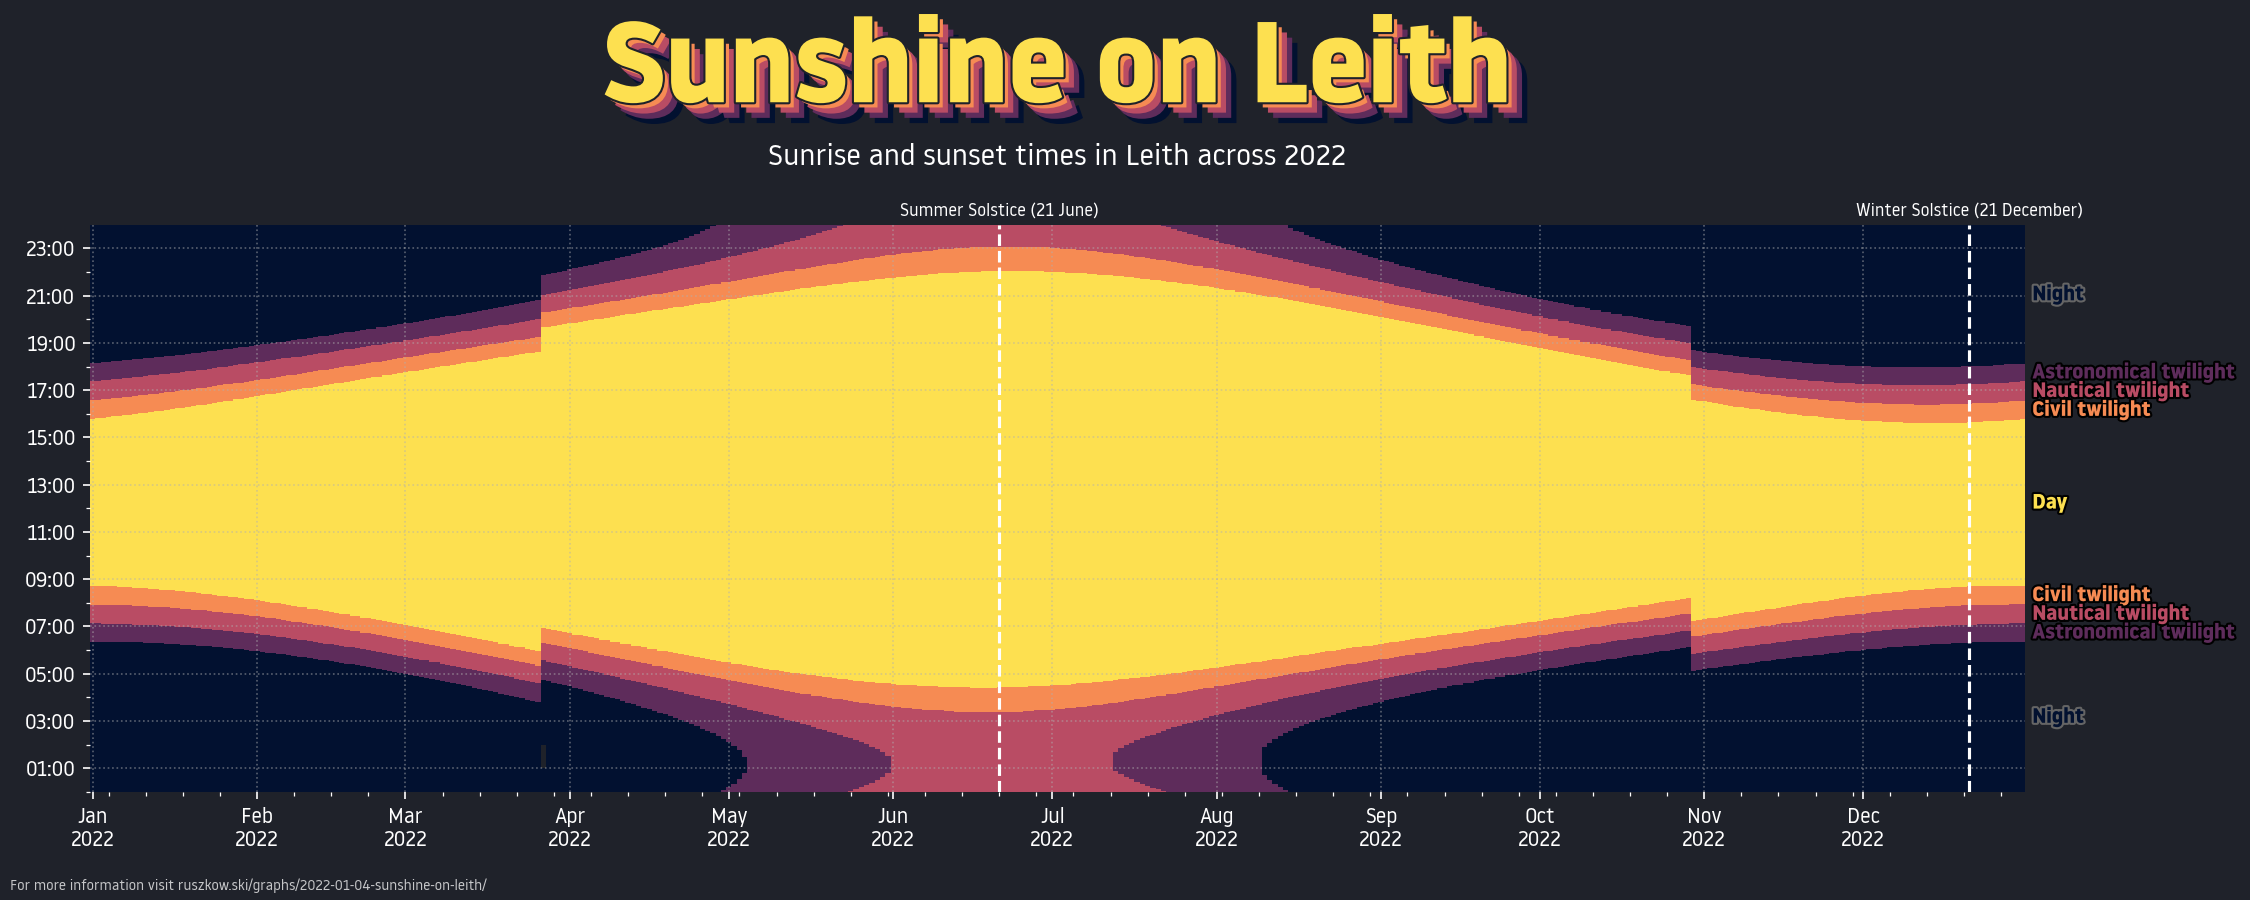
I recently saw a very nice tweet about sunrise and sunset times in London. It looked a lot like a matplotlib graph, so I decided to look into how it could have been made. A bit of googling took me to an excellent blog post about undertaking very similar tasks, from which I learned about different kinds of twilight. I then realised switching the focus to Edinburgh gave an opportunity for a terrible pun and decided to make my own, so here we are.
How?
Though the above blog post references PyEphem, skyfield seems to be a more modern approach to the same kinds of calculations, so I worked with it instead. Its documentation gives perfect examples on finding the various twilight times, alongside identifying equinoxies and solstices. Coupling these with a bit of pandas gave me something I could pass to axpcolormesh, from which point it was just a case of playing about with matplotlib until I thought it looked nice.
As this is an area of study I am completely and utterly unfamiliar with it’s entirely possible that there are some errors here, but the profile looked similar enough to those given by other sources that I don’t think it’s too far off.
Libraries / Resources
skyfieldfor the calculationspandas/numpyfor data wranglingmatplotlibfor plotting- Noway for the font
Data Sources
No external sources - the calculations are all done within skyfield itself.
Code
Find it on Github